
The UpRival Dashboard
Customize your UpRival dashboard to receive better at-a-glance reporting.
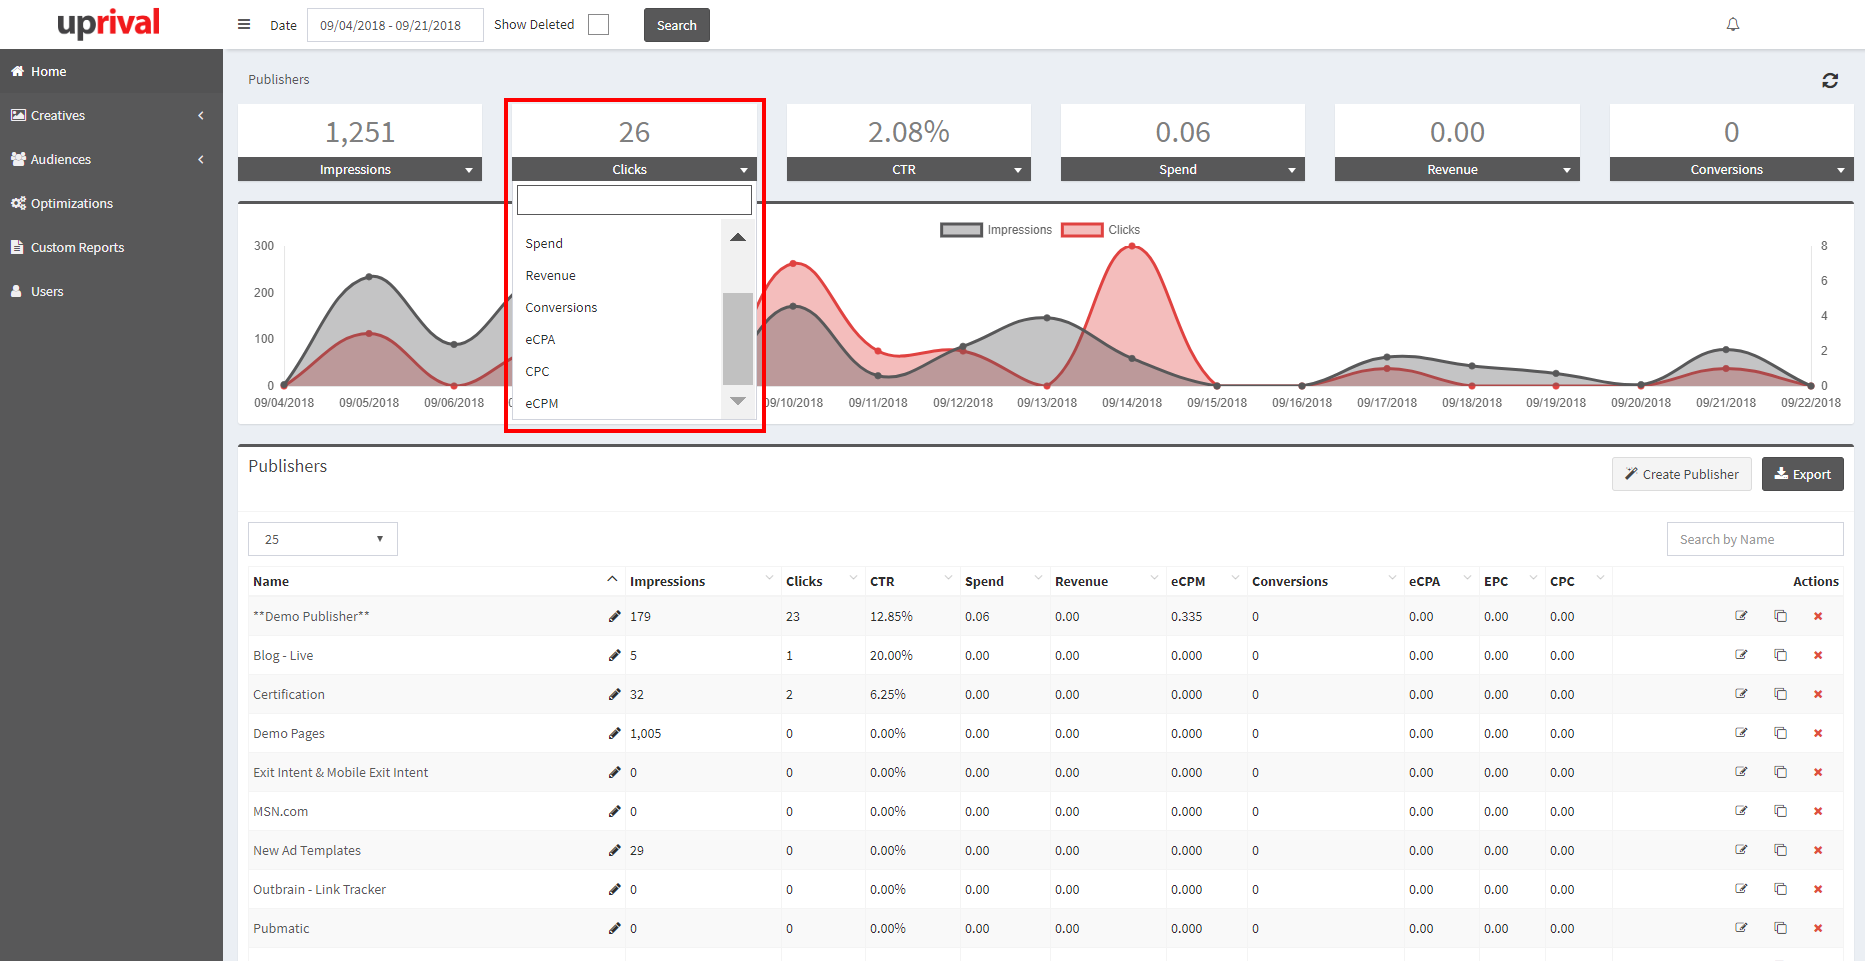
In your UpRival dashboard, you're able to make a few adjustments in order to get the most out of your statistics. Towards the top of the dashboard, there are several tiles that allow you to view Key Performance Indicators (KPIs).
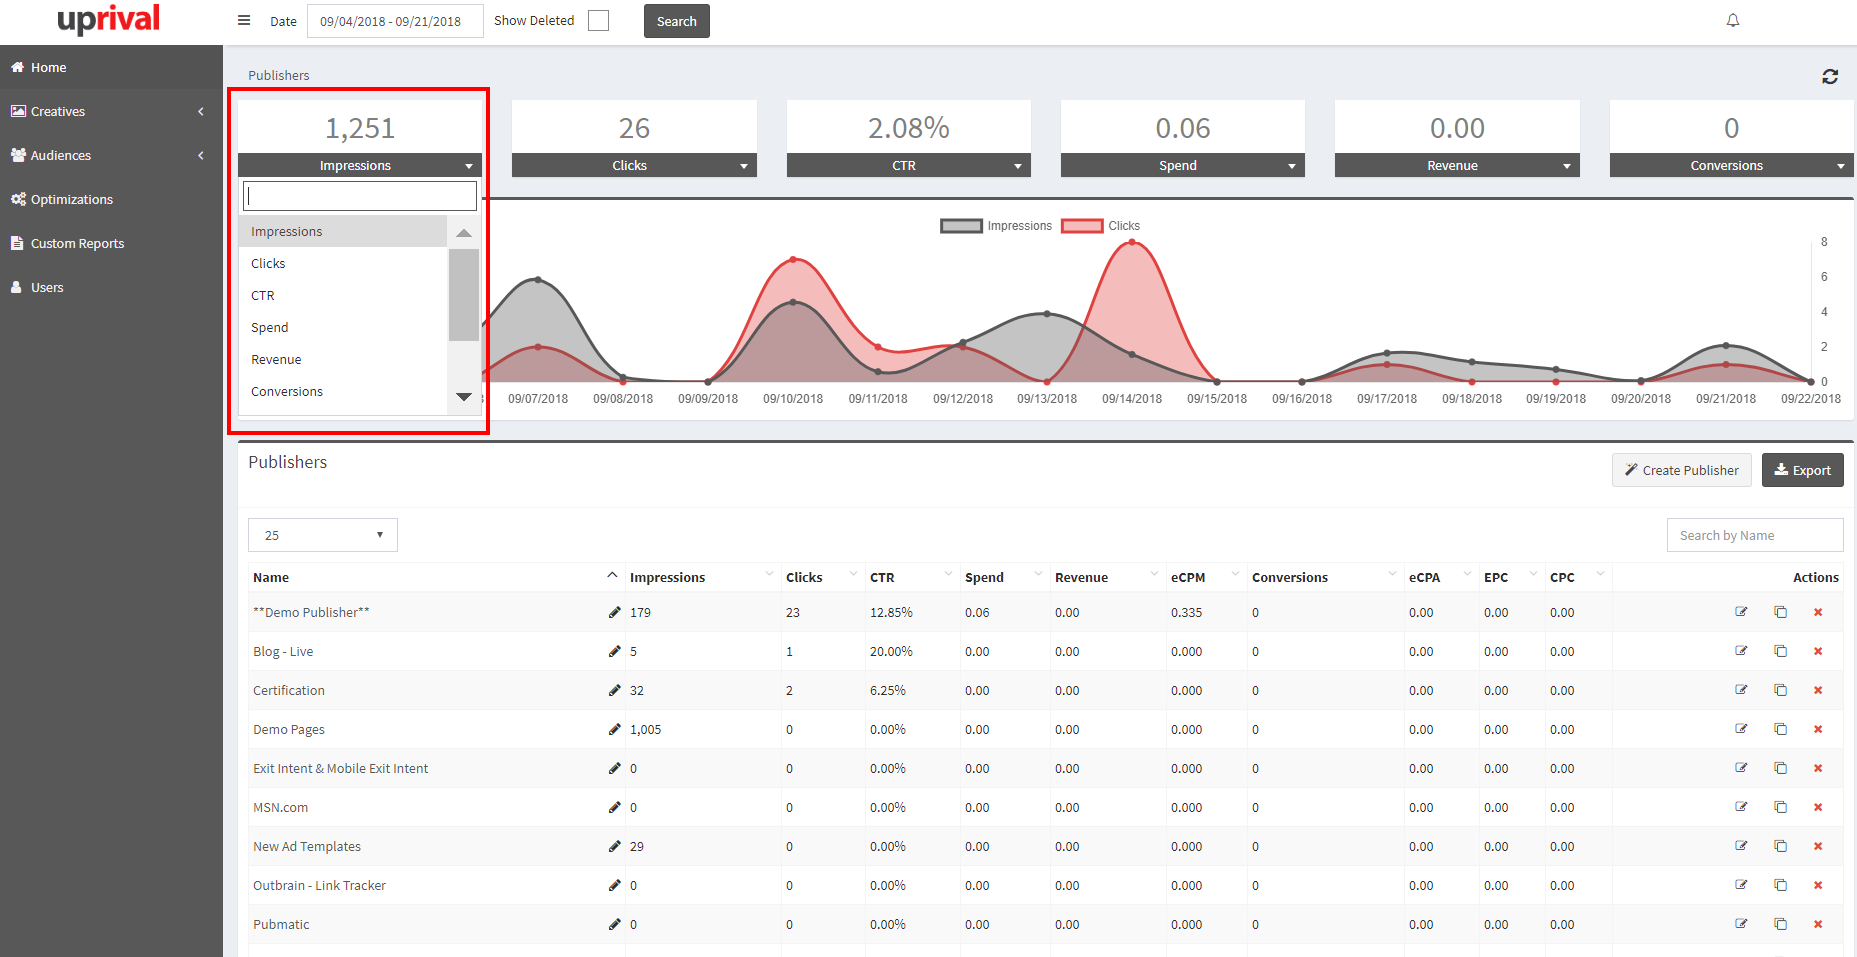
These KPIs can be customized to show any combination of Impressions, Clicks, CTR, Spend, Revenue, Conversions, eCPA, CPC, or eCPM. Once you've made your adjustments, the settings are cookied into your browser, which means you won't have to adjust these settings each time you login.
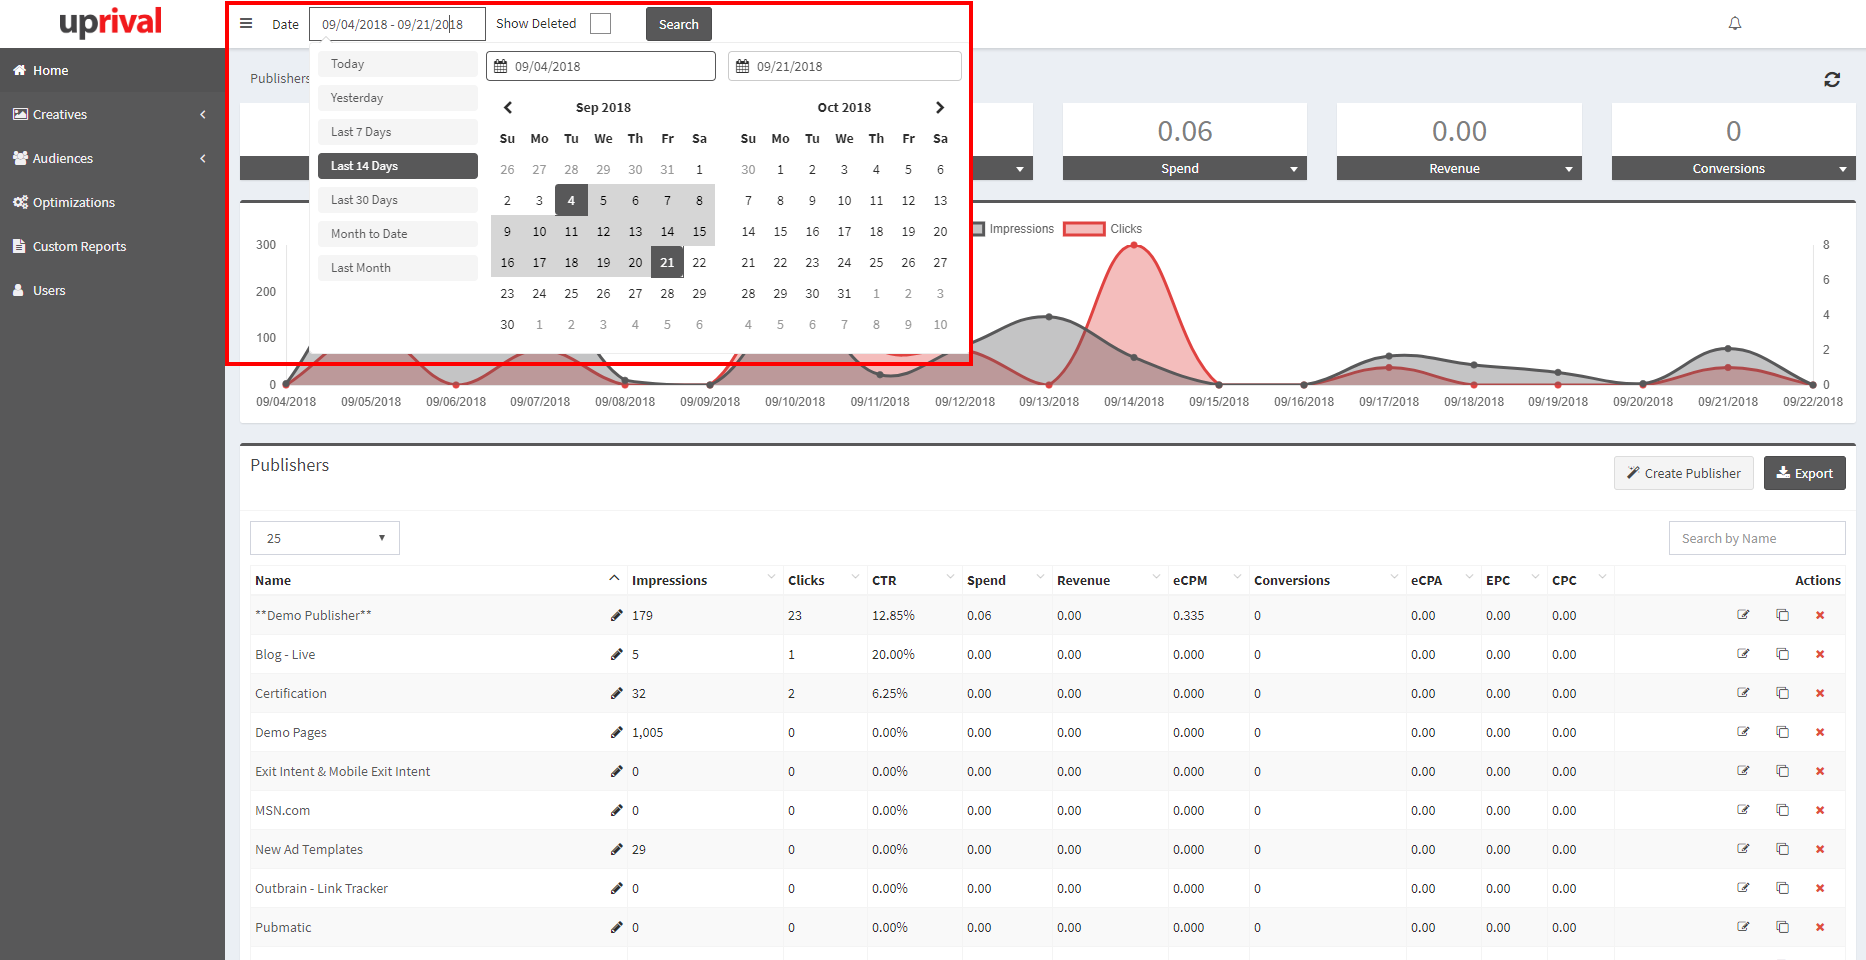
Metrics are always defaulted to show the day of, however the date range of your KPIs can be adjusted in the upper left-hand corner of the dashboard. You can select any of the shortcuts available, such as Last 7 Days, Month to Date, etc., or you can select custom date ranges. Make sure you press Search after selecting the dates - this must be done in order to refresh the page.
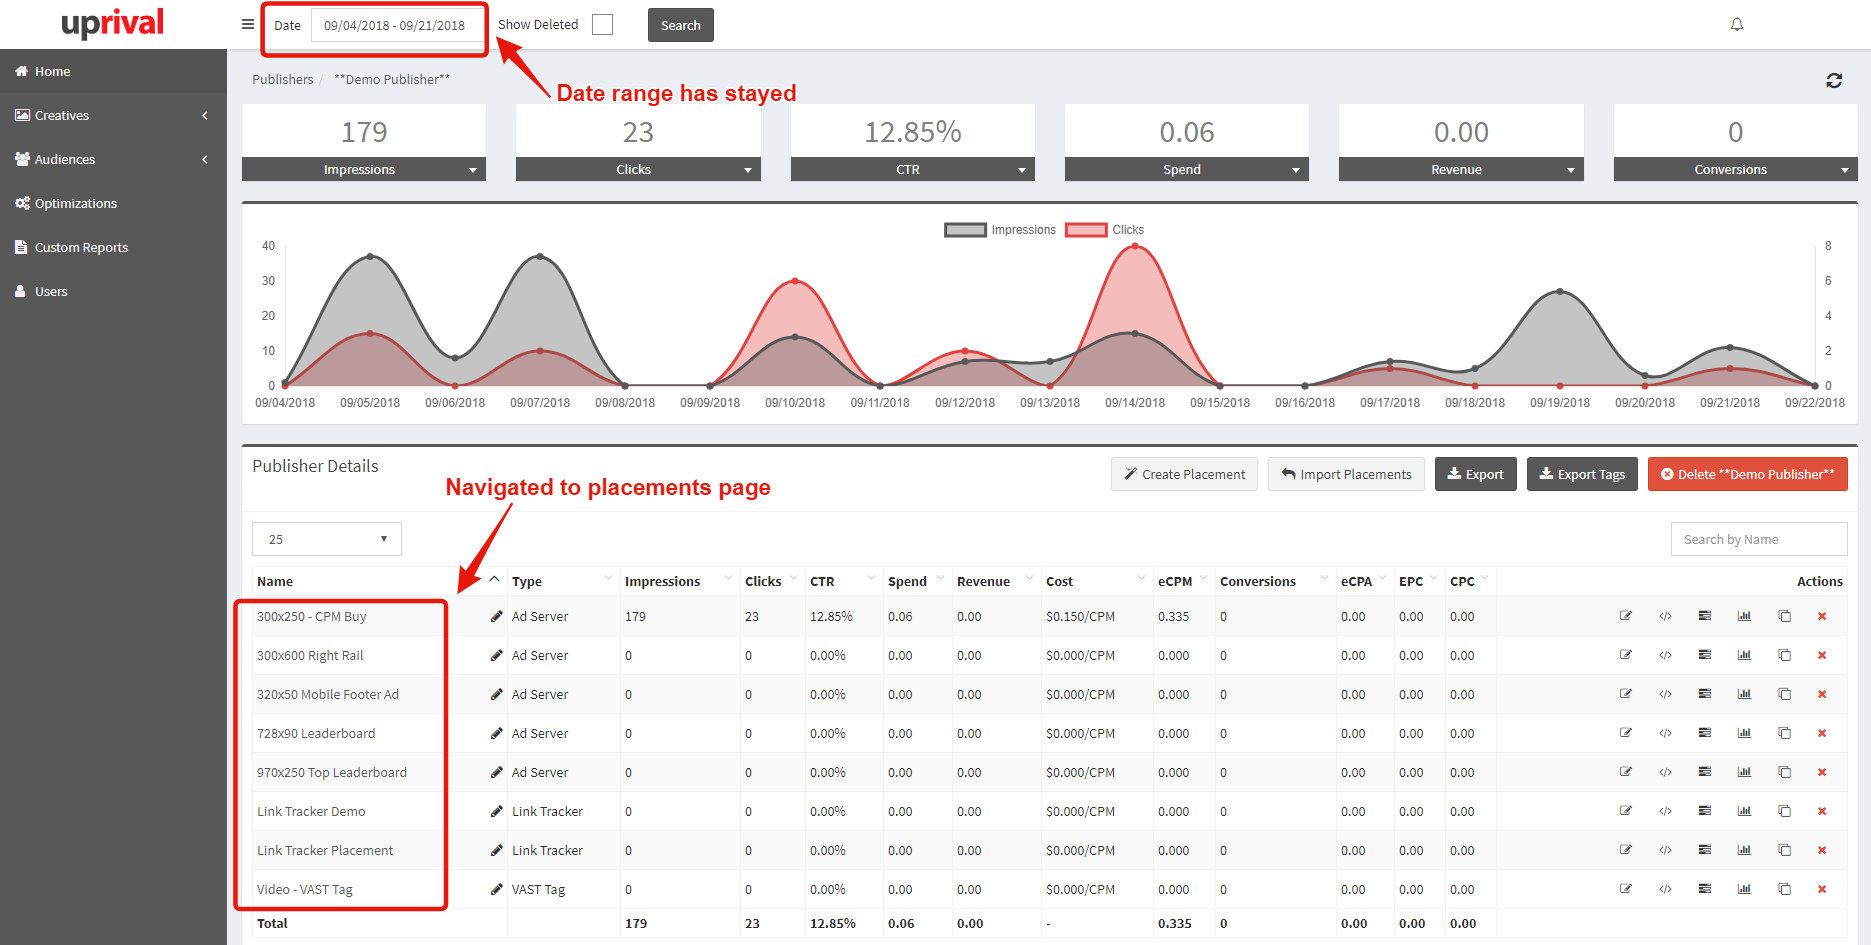
Once you've selected the dates and pressed the Search button, your UpRival dashboard will be updated within the statistics graph, the KPI tiles, and all in-line publisher reporting.
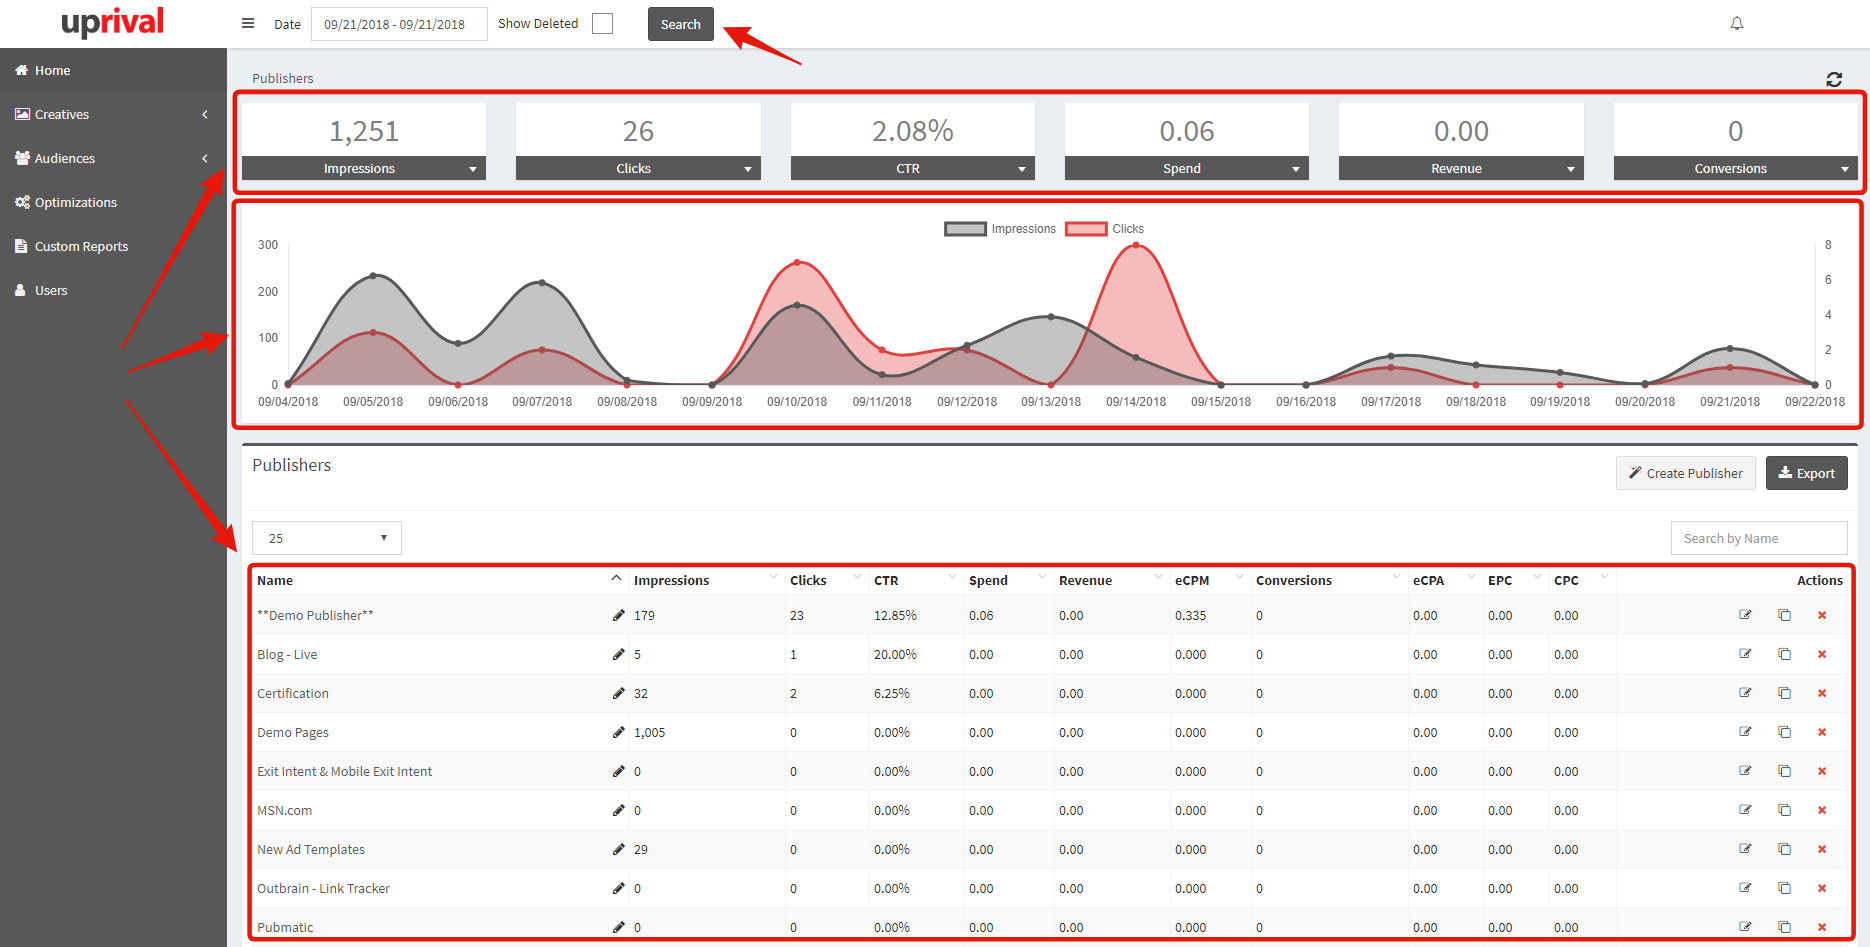
By selecting this date range, your dashboard will be updated until you navigate to a different tab within the main menu, go back to Home, or select a new date range. This means that as your navigate through your Placements and Ad Groups/Ads, they will also show statistics for the selected date range:
For more details on reporting, see additional reporting articles here.